2020 Migration Patterns
Based on 64,858 Interstate and Cross-Border Household Goods Relocations from January 1, 2020 through December 11, 2020.
(Click on individual state/province for 10-year historical data.)
View PDF Version (1 MB)
2020 Migration Study Infographic
View the Migration Patterns Archives

Where is America Moving?
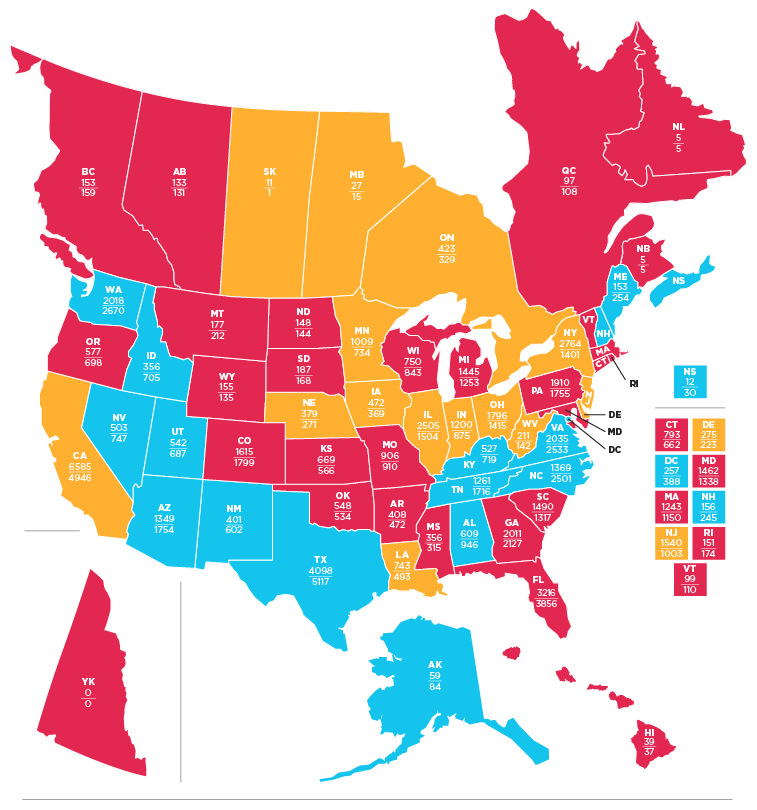
According to one of the nation’s leading movers, the 2020 Atlas® Van Lines Migration Patterns Study found that 23 U.S. states registered as balanced—meaning that moves in and out of the states were roughly equal—12 as outbound, and 15 as inbound, in addition to Washington, D.C. The data also showed a decrease in moves from 2019 to 2020. The company has conducted the study since 1993 to track the nation’s interstate (between states), cross-border (U.S. to Canada only), and international (between countries) moving patterns annually as reflected in moves handled by Atlas®.
Millions of Americans relocated in 2020 because of COVID-19, moving out of college dorms that abruptly closed, moving back to home states to work remotely, moving out of housing that no longer suited their lifestyle and more. Alternatively, companies relocated employees at much lower rates for work assignments in the U.S. and abroad. It’s clear COVID-19 was a deciding factor in moving patterns in 2020, having a unique impact on moving trends.
The 10 U.S. states with the highest percentage of inbound moves and outbound moves in 2020 are included in order below, with Idaho ranking as the study’s inbound leader for the fourth time since 2016. New York was the country’s outbound move leader in 2020, a designation it has now held two years in a row. The state also experienced its highest percentage of outbound moves since the study’s inception. Former balanced state Kentucky achieved an inbound status for the first time since 2010 while California earned an outbound status for the first time since 1995. Additionally, Minnesota and New Jersey saw the highest percentage of outbound moves since 2014 and 2009.
inbound:
- Idaho (66.4 percent)
- North Carolina (64.6 percent)
- Maine (62.4 percent)
- New Hampshire (61.6 percent)
- Alabama (60.8 percent)
- District of Columbia (60.2 percent)
- New Mexico (60.0 percent)
- Nevada (59.8 percent)
- Alaska (58.6 percent)
- Kentucky (57.7 percent)
outbound:
- New York (66.4 percent)
- Illinois (62.5 percent)
- New Jersey (60.6 percent)
- Louisiana (60.1 percent)
- West Virignia (59.8 percent)
- Nebraska (58.3 percent)
- Minnesoat (57.9 percent)
- Indiana (57.8 percent)
- California (57.1 percent)
- Iowa (56.1 percent)
International Top 10: Destinations & Origins
According to data reflecting the total number of international household moves completed by Atlas World Group International, the top international destinations and origins for 2020 include the following U.S. states and global countries:
Top 10 International Origins
- Japan
- South Korea
- Saudi Arabia
- Germany
- United Kingdom
- Bahrain
- Italy
- China
- Colombia
- Philippines
Top 10 International Destinations
- Japan
- South Korea
- Germany
- United Kingdom
- Canada
- Turkey
- Israel
- Italy
- China
- Saudi Arabia
The year’s total number of interstate and cross-border moves in North America totaled 64,858 in 2020, down from 66,308 in 2019. Atlas® World Group International conducted 4,187 international household goods moves in 2020, down from 7,821 in 2019 due to COVID-19 restrictions around the globe. Atlas® World Group reported billed cargo weight and billed miles per move for the first time, with 487,940,515 pounds of household goods moved a total of 65,092,771 miles in North America. On average in 2020, a household moved 7,523 pounds of goods approximately 1,004 miles.
Other migration trends:
Northeast U.S. Region
The Northeast states experienced five significant changes from 2019 to 2020, with Pennsylvania moving from outbound to balanced and Rhode Island moving from inbound to balanced. Maine and New Hampshire are the only Northeast states to be listed on the top inbound state list. Both of these states moved from balanced to inbound in conjunction with Connecticut in 2020. In addition to being 2020’s outbound move leader and experiencing its highest percentage of outbound moves in study history, New York has remained outbound for more than 20 years running.
South U.S. Region
In 2020, the South region saw two changes from 2019. Virginia transitioned from balanced to inbound, a classification it last held in 2018, and Kentucky went from balanced to inbound, a classification it has not held since 2010. The South region housed four of the 10 leading inbound destinations in 2020 (North Carolina, Alabama, Kentucky and Washington D.C).
Midwest U.S. Region
The Midwest registered two changes in 2020, with Ohio shifting from balanced to outbound and South Dakota shifting from outbound to balanced, a classification it has not held since 2014. The Midwest region registered the most outbound states with Illinois, Nebraska, Minnesota, Indiana and Iowa ranking in the top 10. For the fourth year in a row, the Midwest registered zero inbound states.
West U.S. Region
For the fourth time in the last five years, Idaho led in inbound moves with nearly 67% of its moves entering the state in 2020. California classified as outbound for the first time since 1995 and Utah as inbound for the first time since 1995. The West region housed four of the leading inbound states for 2020 (Idaho, New Mexico, Nevada and Alaska).
Canadian Provinces
According to data reflecting U.S. interstate and cross-border moves, five of the Canadian provinces registered a change from 2019 to 2020, with British Columbia and New Brunswick registering from outbound to inbound, and Alberta, Quebec and Newfoundland & Labrador all changing from outbound to balanced.
How status is determined
Each state's or province's status is determined by its threshold value, which is the total number of shipments multiplied by 0.55 (i.e., in a state with 100 moves, at least 55 must be outgoing to be considered outbound). All other states or provinces in which outbound or inbound numbers don't exceed the threshold are classified as balanced. Canadian interprovincial and cross-border (from the U.S. to Canada) shipments are both referenced in the study. International moves indicate both states and countries that Atlas World Group International sent the most shipments to from international origin countries in 2019.
About Atlas® Van Lines
Atlas® Van Lines, a national moving company, is the largest subsidiary of Atlas® World Group, an Evansville, Ind.-based company. Atlas World Group companies employ nearly 800 people throughout North America. Over 430 Atlas interstate moving agents in the United States and Canada specialize in corporate relocation, household moving services, and in the specialized transportation of high-value items such as electronics, fine art, store fixtures, and furniture.